Traditional trading in the stock market is not all that unlike than day trading. In day trading, basically all of your positions are closed at the end of a given trading session.
Day trading has a good amount of risk. That means that even though there is more and more talk of day trading, and more people are learning how to be a day trader for them, this is risky business and should be approached with that knowledge.
Line Charts
Supported by most charting software, Line Charts are used often. However, this type of stock chart shows only one piece of trading information. A line chart can be structured to show you any one of the following items: The Open, Close, High or Low of the trading time frame you are searching. This is what makes them easy to use.
Bar Charts
When you begin to need more than one piece of the puzzle at a time, a bar chart may give you just what you need. Bar charts include all standard trading information. This means you will get opening price, closing price, highs and lows all at a glance.
Candlestick Charts
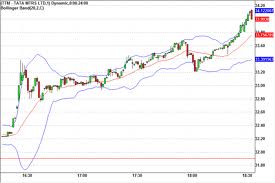
Sitting right next to bar charts on the popularity table is the candlestick chart. The candlestick chart, like the bar chart, contains opening and closing prices as well as the highs and lows of the time period you are searching. Candlestick charts show whether the bar closed higher than it opened (an upward candlestick) or closed lower than it opened (a downward candlestick). By looking at the highs and lows of a candlestick chart, you can easily determine the range of the bar; the distance between the high and the low.
The information above is the very basic of the stock charts that help traders go about their day to day business. By learning how to read stock charts such as these, you can do profitable trades and secure your financial future.
Related Posts :
- Where to invest for better returns
- What is the circuit
- Why Invest in Gold?
- Why many People Lose Money in the Market


